FINANCIAL HIGHLIGHTS
Textron Inc. is a $14.0 billion multi-industry company with approximately 35,000 employees. The Company leverages its global network of aircraft, defense, industrial, and finance businesses to provide customers with innovative products and services. Textron is known around the world for its powerful brands such as Bell, Cessna, Beechcraft, Hawker, Jacobsen, Kautex, Lycoming, E-Z-GO, Arctic Cat, Textron Systems, and TRU Simulation + Training.
TEXTRON REVENUE BY SEGMENT
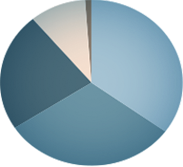
TEXTRON AVIATION 36% INDUSTRIAL 31% BELL 23% TEXTRON SYSTEMS 10% FINANCE <1%
TEXTRON REVENUE BY TYPE
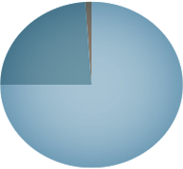
COMMERCIAL 76% U.S. GOVERNMENT 24% FINANCE <1%
TEXTRON REVENUE BY REGION
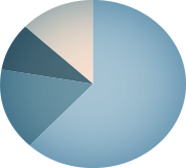
U.S. 62% EUROPE 16% ASIA AND AUSTRALIA 9% OTHER 13%
FINANCIAL HIGHLIGHTS
| Dollars in millions, except per share data | 2018 | 2017 | Change |
|---|---|---|---|
| Revenues1 | $13,972 | $14,198 | (2)% |
| International revenues % | 38% | 38% | |
| Segment profit2 | $1,267 | $1,169 | 8% |
| Income from continuing operations—GAAP | $1,222 | $306 | 299% |
| Adjusted income from continuing | |||
| operations—Non-GAAP3 | $845 | $658 | 28% |
| Manufacturing group debt4 | $3,066 | $3,088 | (1)% |
| Shareholders’ equity | $5,192 | $5,647 | (8)% |
| Manufacturing Group debt-to-capital (net of cash)4 | 29% | 26% | |
| Common Share Data | |||
| Diluted EPS from continuing operations—GAAP | $4.83 | $1.14 | 324% |
| Adjusted diluted EPS from continuing | |||
| operations—Non-GAAP3 | $3.34 | $2.45 | 36% |
| Dividends per share | $0.08 | $0.08 | — |
| Diluted average shares outstanding (in thousands) | 253,237 | 268,750 | (6)% |
| Key Performance Metrics | |||
| ROIC5 | 13.0% | 9.8% | |
| Net cash provided by operating activities of continuing | |||
| operations—Manufacturing group—GAAP6 | $1,127 | $930 | 21% |
| Manufacturing cash flow before pension | |||
| contributions—Non-GAAP4, 6, 7 | $784 | $872 | (10)% |
| Manufacturing pension contributions4 | $52 | $358 | (85)% |
| Capital expenditures | $369 | $423 | (13)% |
| Net Debt | |||
| Finance group debt | $718 | $824 | $(106) |
| Manufacturing group debt4 | $3,066 | $3,088 | $(22) |
| Total debt | $3,784 | $3,912 | $(128) |
| Less: Consolidated cash and equivalents | $1,107 | $1,262 | $(155) |
| Net Debt | $2,677 | $2,650 | $27 |
| 1 | At the beginning of 2018, we adopted ASC 606 using a modified retrospective basis and as a result, the comparative information has not been restated and is reported under the accounting standards in effect for these periods. |
| 2 | Segment profit is an important measure used for evaluating performance and for decision-making purposes. Segment profit for the manufacturing segments excludes interest expense, certain corporate expenses, gains/losses on major business dispositions and special charges. The measurement for the Finance segment includes interest income and expense along with intercompany interest income and expense. |
| 3 | Adjusted income from continuing operations and Adjusted diluted EPS from continuing operations are Non-GAAP measures. For reconciliation to GAAP, see Footnote 6 from the “Financial Data 2018-2017” page within the “Financial Information” section of this Fact Book. |
| 4 | Our Manufacturing group includes all continuing operations of Textron Inc., except for the Finance segment. |
| 5 | Calculation of return on invested capital (“ROIC”) is provided on the “ROIC” page within the “Financial Information” section of this Fact Book. |
| 6 | For 2017, $17 million of net proceeds from the settlement of corporate-owned life insurance policies were reclassified from operating activities to investing activities as a result of the adoption of a new accounting standard at the beginning of 2018. |
| 7 | Manufacturing cash flow before pension contributions is a Non-GAAP measure. For reconciliation to GAAP, see Footnote 2 from the “Selected Financial Statistics 2018-2014” page within the “Financial Information” section of this Fact Book. |